Supplementary materials
Setup
Thermocouple
In this lab we use a type T thermocouple with its reference end held at 22°C.
This week’s lab is the only one when: you don’t have to prepare the full lab report, only the abbreviated version that includes:
Analyze all 6 demo videos and plot the resistance change vs temperature for all of them in one plot. Please read carefully all the requirements to how the scientific graph should look like in the Lab report content page. Since the measured curves are expected to be relatively similar, make sure they are distinguishable by color and/or marker type, and that you provide the legend, clearly indicating which curve corresponds to each trial. (You don’t need to have any theory fits this time!)
Don’t forget to include the caption! It should briefly summarize what is plotted, and what the different traces mean. It is also a good idea to put the constant experimental parameters, like current (which is more or less constant)
The most interesting location is around when the sample becomes superconductive. Think if you need to add a separate plot which shows only this region.
As for discussion, you may consider the following aspects:
The major learning objective for this lab will be the plotting the results of the measurements using Matlab (or any other scientific software you know). If you plan on using Matlab and not familiar with it already, please make sure you watch the MATLAB tutorials and make sure you can access Matlab on your computer (you can install in or register to use on-line version).
Superconductivity refers to the effect in which the resistivity of a material drops to zero at low temperatures (see a very brief description).
The underlying physics of this effect is rather complex, and requires understanding of quantum behavior of electrons inside a conductor. You may get to it at the end of Modern Physics course (or not). This video attempts to give the explanation on a layman level, but actually it is not entirely accurate.
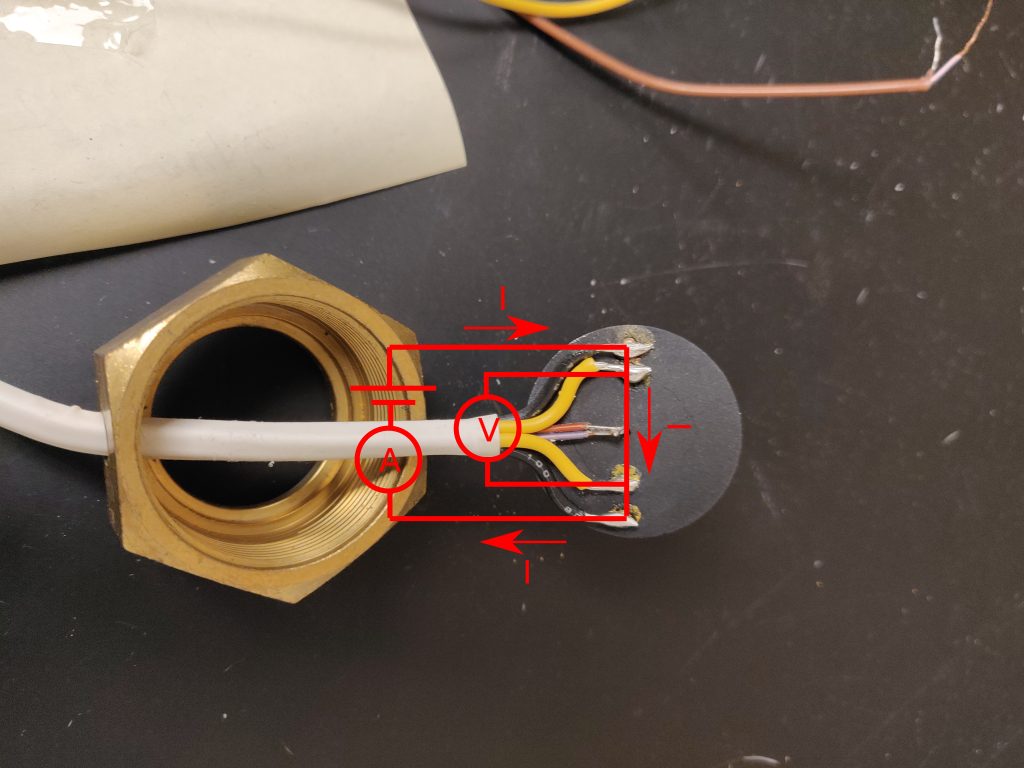
Instead of trying to grasp the complicated nature of superconductivity, we instead concentrate on measuring the critical temperature, i.e. the temperature at which the resistivity of the YBCO ceramic goes to zero. Because measuring a very low resistance is not easy, please make sure to watch the video about the four-probe method
During the class we will be using video recordings of the experimental setup to create the graph. There is no need to watch the videos in advance (no spoilers!), but if your internet is spotty, feel free to preload them.
In this lab we use a type T thermocouple with its reference end held at 22°C.